Questions & Answers About IoT Sensors and Remote Monitoring
This article distills five expert questions from the Boosting ROI with Smart Sensors & Industrial IoT Webinar, featuring Eric Schummer – CEO of Senzary and Matt Coughlin, Engineer and Owner of Baghouse.com, into practical guidance for bringing this technology to your dust collection systems.
— "Are there software tools for predicting possible failures in IoT networks?"
Yes. There are software tools for predicting maintenance and failures, and this is a major driver for many customers. Tools address different equipment types—vibratory, rotational, conveyors, elevators, pumps and motors, kilns, and more—by monitoring a range of signals such as gas concentrations (over 20 gases), inclinations, tilts, vibrations, pressures, and even metal particles in oil.
By analyzing these data points over time, they help reveal how a system degrades, enabling predictive maintenance decisions, whether manual or automated.
— "How do sensors and gateways maintain uptime?"
LoRaWAN is a service-enabled protocol that ensures robust uptime. The system continuously monitors every packet in real time and coordinates between sensors and gateways 24/7, adjusting for distance, noise, quality, and signal conditions. Sensors are designed to save battery life and rejoin the network after disruptions, with transmissions typically under one second due to small payloads.
The platform uses multiple gateways and selects the best one for each transmission. AI tools monitor packet counts, missing packets, and signal degradation to identify issues early, such as a gateway disconnect, supporting proactive maintenance and uptime.
— "How to measure dust and noise in concrete plants?"
Dust sensors measure both particle counts and particle mass, with counts and mass expressed on scales tied to health-relevant metrics. Particle counts may use very fine measurements (down to small PPM-like scales in some contexts, e.g., data centers), while common regulatory references use 2.5 and 10 micrometer equivalents. Particle mass concentration per cubic meter is also tracked, using scattered lasers from compact, portable sensors that can be placed in various locations.
Noise is measured as air-pressure–based sound levels (decibels) for regulatory and worker exposure purposes, and ultrasound ranges (0–80 kHz) can be used to monitor equipment like conveyors and motors for predictive maintenance. The discussion also suggests evaluating the dust collection system’s basics (sizing, hood design, capture velocities) to maximize the effectiveness of IoT sensing.
— "What are the Basics Before IoT Implementation?"
Before IoT deployment you should establish solid dust collection basics. This includes having systems sized appropriately, with proper hood design and capture velocities—the “dust collection 101.”
Once these fundamentals are in place and functioning, IoT sensors and predictive maintenance tools can provide meaningful monitoring and optimization rather than chasing issues after they occur.
— "Can sensors handle heat and dust?"
Yes. The sensors are described as protected electronics with IP67 ratings, meaning they are resistant to water and dust ingress and suitable for harsh environments. The transcript cites real-world examples of sensors operating in extreme conditions, including 400–500 degrees Celsius (or Fahrenheit) in steel industry contexts, demonstrating that these devices can function reliably in hot, dusty industrial settings.
Every facility is different, and the remote monitoring needs of your systems can vary widely depending on your dust, equipment, layout, and production demands.
If you didn’t see your question here—or if you’re dealing with a specific issue in your system—don’t hesitate to reach out. Our team is always available to help you find practical, effective solutions and guide you through any challenges you may be facing.
We’d be glad to answer your questions and support you in improving the safety of your dust collection system.
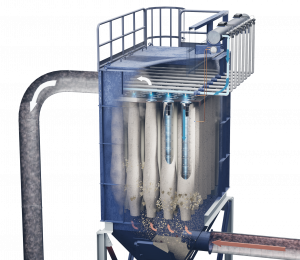
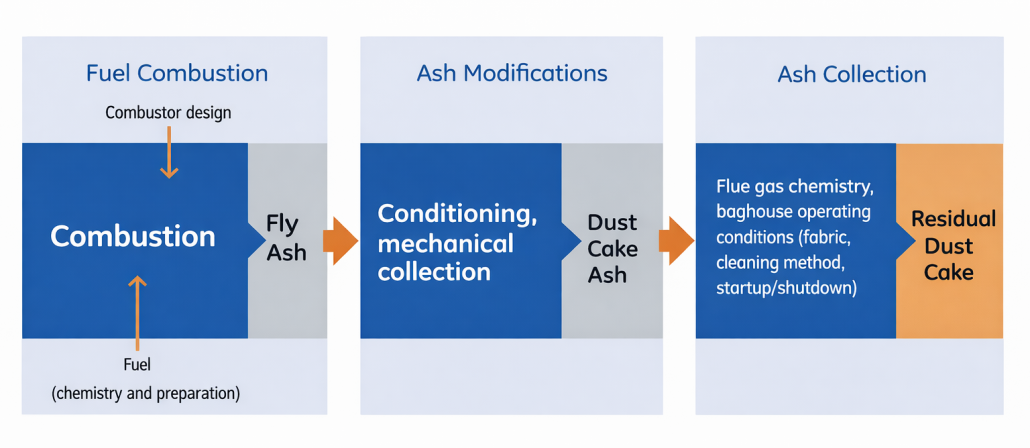
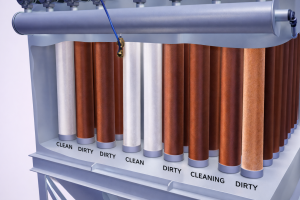
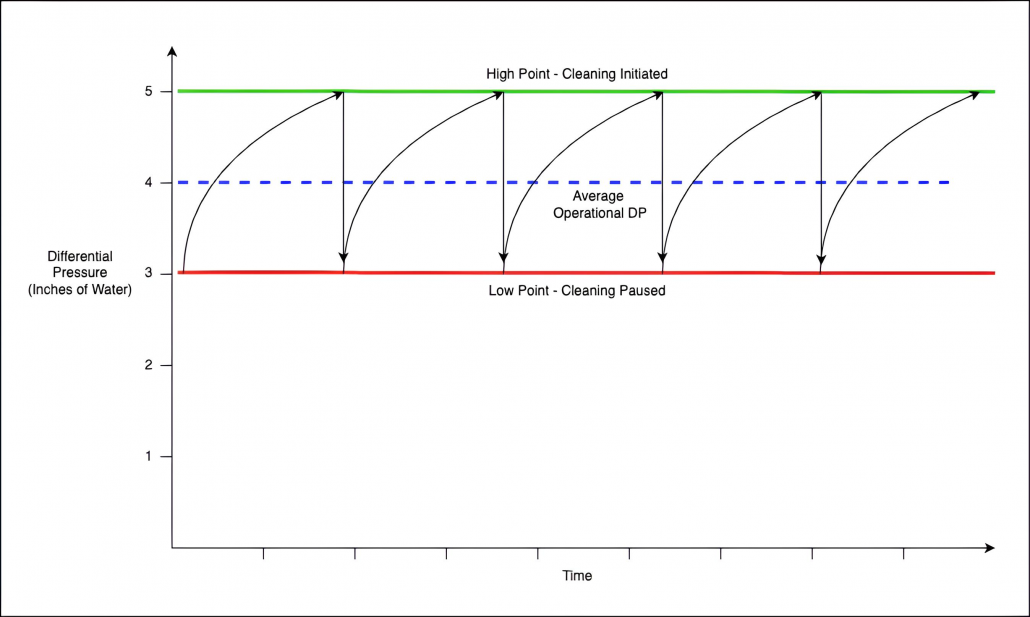
 In pulse-jet baghouses, filtration does not primarily happen within the filter fibers themselves. Instead, the system relies on something called a filter cake.
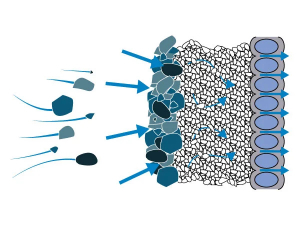

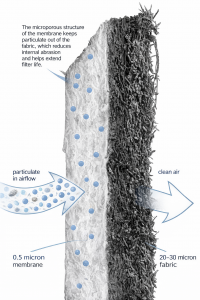 When PTFE membrane is added to the filter media, collection efficiency increases even further.

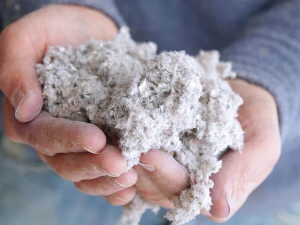 Paper and packaging dust is deceptively light. Cellulose fibers, tissue dust, and cardboard fines don’t fall out of the air the way heavier industrial dusts do. They stay suspended, migrate through buildings, and settle in places operators rarely inspect until there is already a problem. Cutting, slitting, die-cutting, rewinding, conveying, baling, and finishing all generate fine particles that disperse quickly if capture velocities drop even slightly.

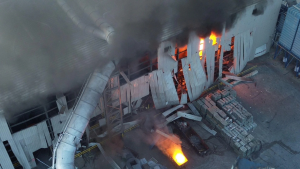
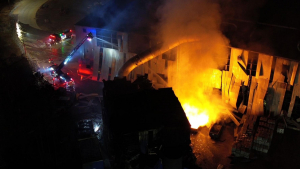
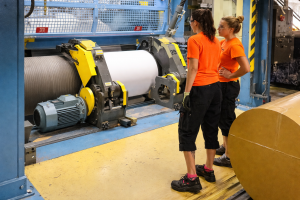 Paper and cardboard dust are dangerous because they combine three problems at once: they are respirable, combustible, and highly mobile. When suspended in air, even relatively low concentrations can ignite if an ignition source is present. When allowed to settle, the dust accumulates rapidly on horizontal surfaces, creating fuel for secondary explosions. From a health standpoint, prolonged exposure also contributes to poor indoor air quality and respiratory issues, particularly in tissue and fine-paper operations.
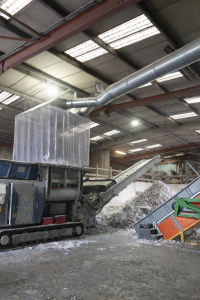
 Can dust collection really reduce downtime in packaging plants?
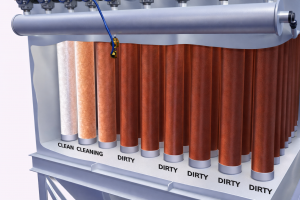

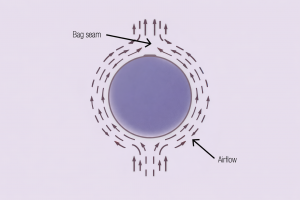

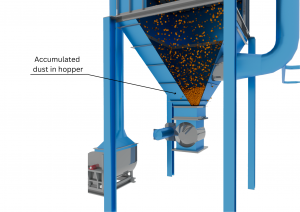
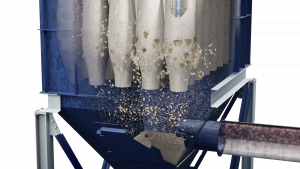
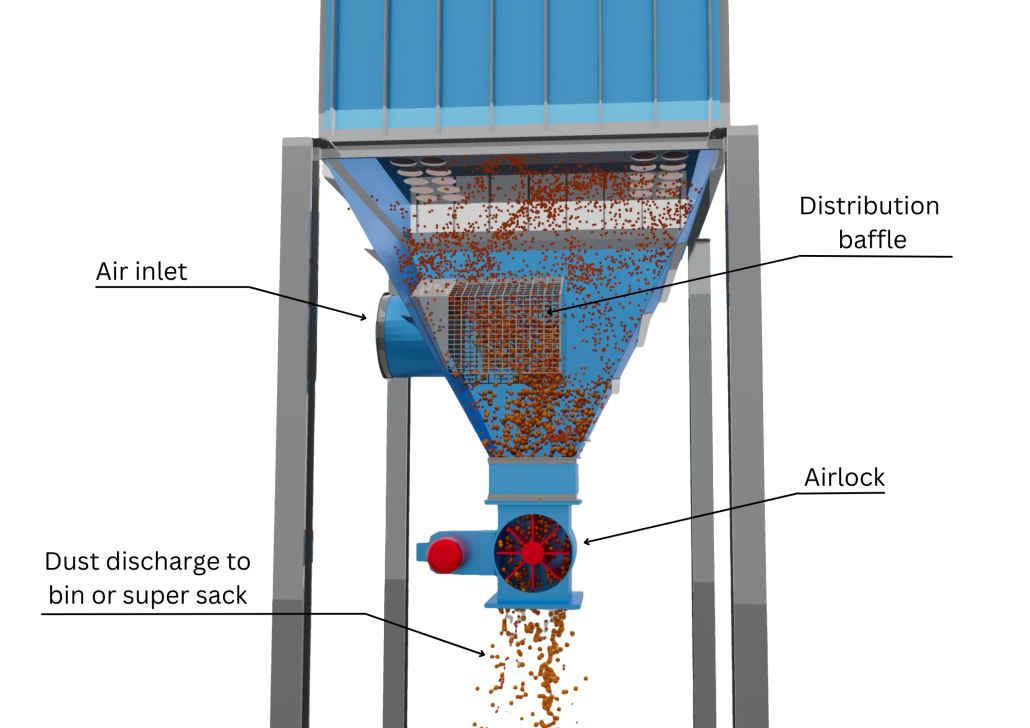 Dust-laden air often enters through a dirty-air inlet located in the hopper below the filters. If that inlet directs airflow downward or creates excessive turbulence, dust can swirl upward and become re-entrained on the bags. The result is higher grain loading than the filters can handle efficiently. Enlarging the inlet to reduce velocity or installing a ladder vane baffle inside the hopper can dramatically improve airflow distribution. These baffles are typically inexpensive and easy to install, yet they reduce turbulence, minimize re-entrainment, and protect the filters from uneven loading and abrasion.