Most dust collection systems don’t fail overnight. They slowly drift away from their original design until one day emissions spike, operators start complaining, or the fan is pulling way more horsepower than it should. By then, you are reacting instead of managing.
System-wide testing is how you catch those problems early. Done correctly, testing tells you whether your dust control system is still doing the job it was designed to do, and whether it can safely handle today’s production demands.
Why Testing Matters in the Real World
Designing a baghouse system requires careful calculation and optimization of multiple design variables to ensure reliable performance, regulatory compliance, and long-term durability.
There are two core reasons to test a dust collection system. First, to confirm the system is operating as designed. Duct velocities, airflow at hoods, pressure drop across the collector, and fan performance all drift over time due to wear, buildup, and process changes. Second, to verify that the system is actually reducing airborne dust and employee exposure. A baghouse can be running, fans spinning, gauges moving, and still not be controlling dust effectively where it matters most. Testing connects airflow numbers to real exposure reduction.
What Does Testing Really Involve?
At its core, system testing is about airflow and pressure. Those two things tell you almost everything about how the system is behaving.
A proper test provides data to:
✔️ Check performance against the original design
✔️ Set and lock blast gates correctly
✔️ Identify maintenance problems before they become outages
✔️ Understand whether the system can handle additional pickup points
✔️ Improve future system designs using real operating data
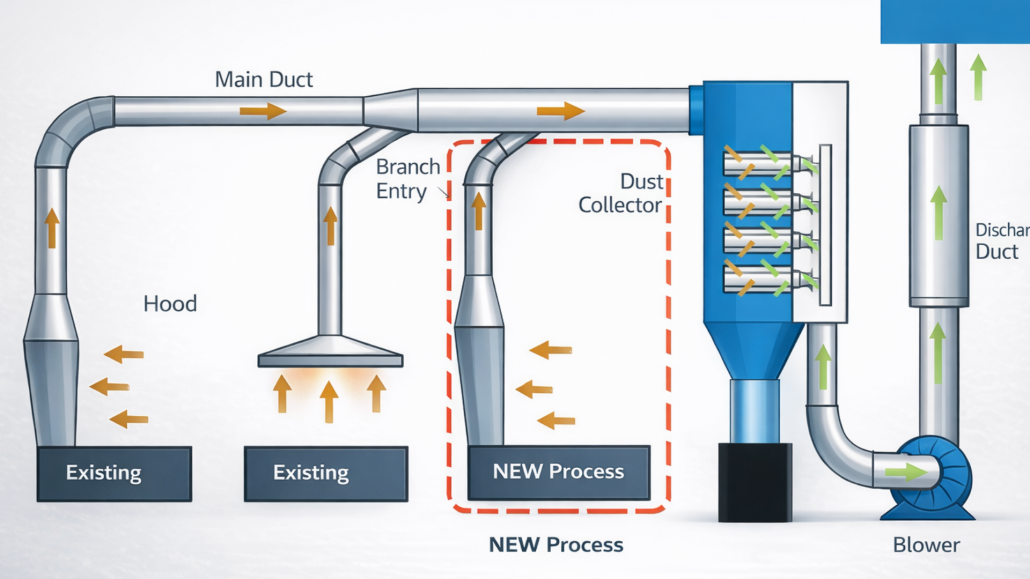
Start With the System, Not the Equipment
Before you touch a manometer or Pitot tube, gather the paperwork. If original drawings and calculations exist, use them. If not, sketch the system yourself. Document duct sizes, lengths, branch locations, fittings, hoods, dampers, and major components. This alone often reveals issues like undersized branches, unnecessary elbows, or field modifications that were never rebalanced. These drawings become your roadmap for where to measure and what results should look like.
Below, you will see a list of the items you will need to perform the inspection:
Evaluation Equipment
✔️ Paper, pencil, recording devices
✔️ Smoke tubes, candles
✔️ Velometer
✔️ Pilot tube, manometer, hoses
✔️ Drill, bits
✔️ Tape measure
✔️ Flashlight
✔️ Ladder
✔️ Rags
✔️ Watch
✔️ RPM meter
✔️ Sound level meter
✔️ Volt/amp meter
Previously Recorded Data
✔️ Original design specifications and drawings
✔️ Original operating conditions
✔️ Modifications
✔️ Past inspection reports
✔️ Persons to contact
✔️ Maintenance schedule
✔️ Controls
✔️ Lockout provisions
✔️ Compliance inspections
✔️ Exposure monitoring records
✔️ Injury and illness history
Employee contact
✔️ Complaints
✔️ Suggestions
✔️ Observed work practices
✔️ Interaction with control
✔️ Interaction with emission source
✔️ Training
✔️ Use of personal protective equipment (PPE)
✔️ Cooperation
Emission Source
✔️ Location of emissions
✔️ Rates of emission
✔️ Chemical characteristics
✔️ Physical characteristics
✔️ Employee exposure levels
✔️ Environment
Hood
✔️ Type (enclosure, receive, capture)
✔️ Capture velocity
✔️ Face velocity
✔️ Performance during normal operation
✔️ Performance during abnormal operation
✔️ Compatibility with work requirements
✔️ Physical integrity
✔️ competing air currents
✔️ Hood static pressure
✔️ Hood entry loss
Ductwork
✔️ Physical integrity
✔️ Plugging and blockage
✔️ Transport velocities
✔️ Duct material
✔️ Changes since last inspection
✔️ Blast gate and damper settings
Air Cleaner
✔️ Physical integrity
✔️ Static pressure drop
✔️ Waste stream handling
✔️ Maintenance and operation
✔️ PM program followed
Fan
✔️ Direction of rotation
✔️ RPM
✔️ Pulleys, belts
✔️ Access doors
✔️ Fan wheel
✔️ Fan housing
✔️ Flexible coupling
✔️ Inlet/outlet
✔️ Stack weather head
✔️ Bearings
✔️ Vibration and noise
✔️ Fan SP/fan TP
Fan Motor
✔️ RPM
✔️ Rated HP
✔️ Amperage
✔️ Actual BHP
✔️ Drive train
✔️ Temperature
✔️ Weather protection
✔️ Vibration
Replacement Air
✔️ Same CFM as exhaust
✔️ Force on doors
✔️ Drafts at exterior walls
✔️ Inlets
✔️ Heat/cooling source
✔️ Distribution
✔️ Interference with capture velocity
✔️ Back-up system
✔️ Monitoring or warning system
Measurement and Calculations
✔️ Hood static pressure
✔️ Capture velocity
✔️ Face velocities
✔️ Duct diameters, lengths
✔️ Duct transport velocities
✔️ Temperature, pressure
✔️ Flow rates
✔️ Fan SP/fan TP
✔️ Fan RPM
✔️ Motor RPM
✔️ Motor amps
✔️ System static pressure
Airflow Measurements
Airflow inside a duct is never uniform. Measuring velocity at a single point gives you misleading data. Proper airflow measurement requires traversing the duct cross-section. Divide the duct into equal areas and measure velocity pressure at the center of each area. The smaller the areas, the more accurate the result.
Velocity is calculated using the relationship:
V = 4005 × √VP
Once you calculate individual velocities, average them, multiply by duct cross-sectional area, and you get airflow in cubic feet per minute.
For best results:
✔️ Perform traverses at least eight duct diameters away from elbows, hoods, or branches
✔️ Make two traverses at right angles whenever possible
✔️ Correct for air density when temperature, moisture, or altitude differ significantly from standard conditions
✔️ Expect dust loading to affect instrument performance and plan accordingly
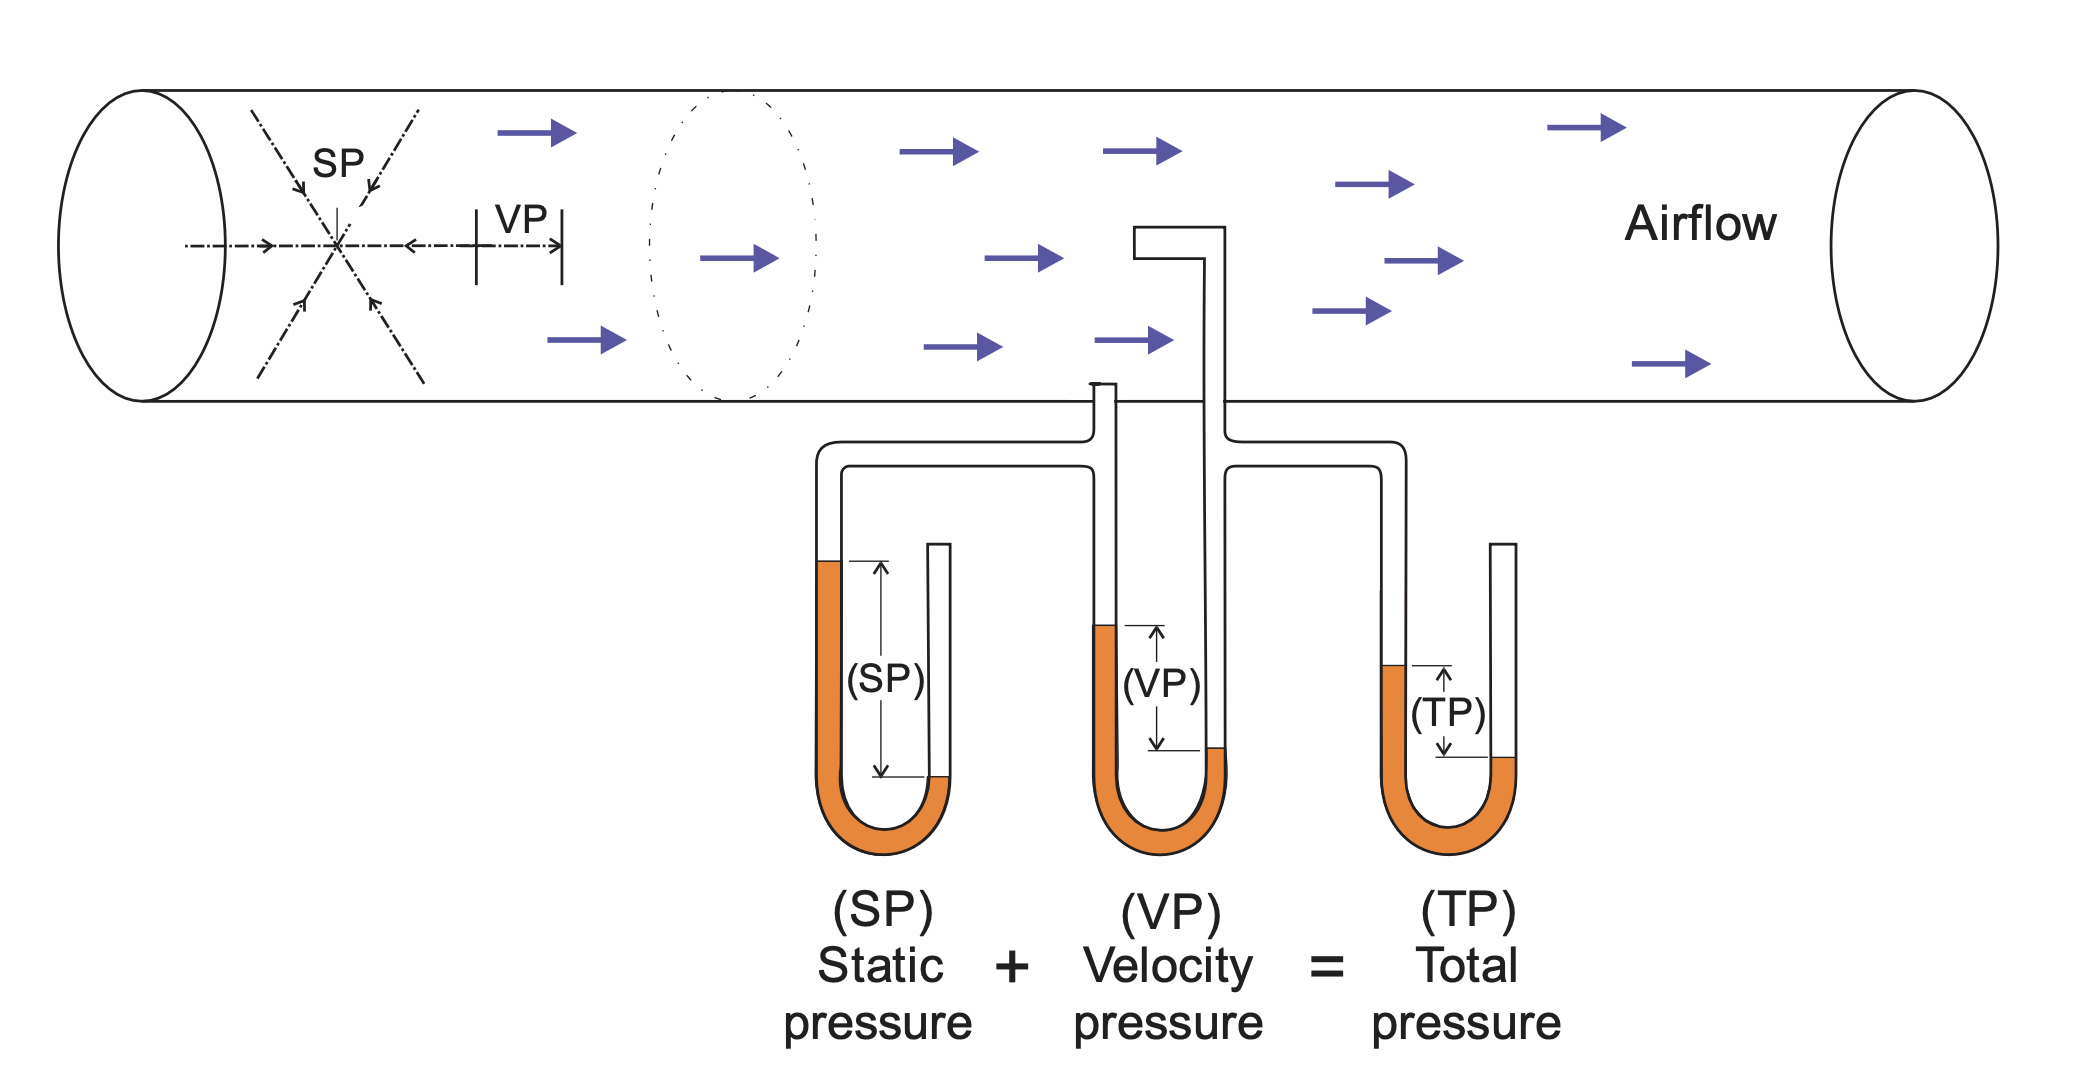
Static Pressure
Static pressure readings are extremely sensitive to how measurement ports are installed. Static pressure taps should be flush with the inside duct wall, drilled rather than punched, and free of burrs. Poorly installed taps can create false readings that send you chasing problems that do not exist.
Relationship between static pressure, velocity pressure, and total pressure. Example represents the suction side of the fan.
Avoid measuring static pressure at elbows or locations with high turbulence. Sudden expansions or contractions in ductwork will distort readings. Static pressure data helps you understand where energy is being lost and whether pressure drops match design expectations.
Common Performance Problems and What They Usually Mean
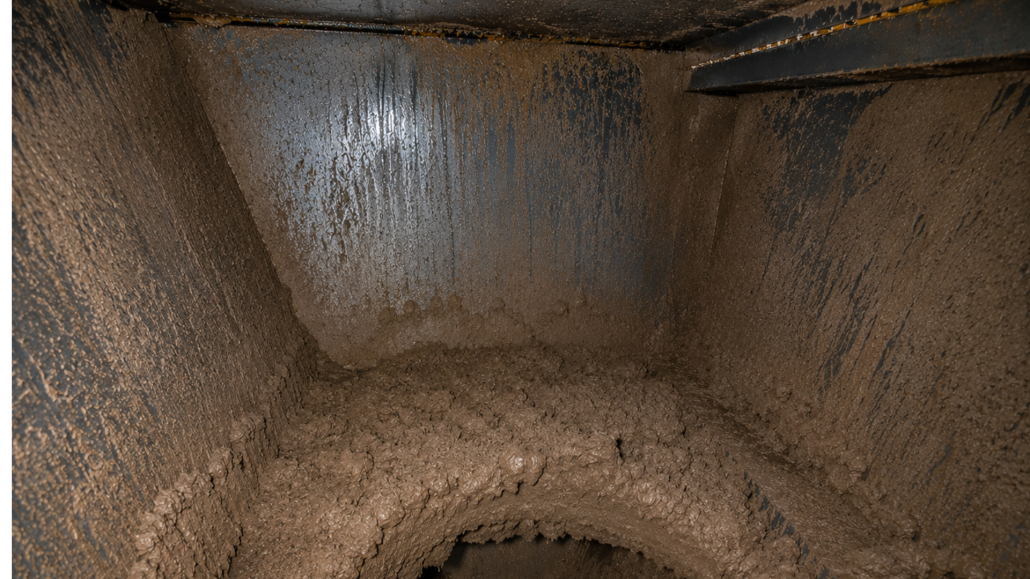
When airflow drops, the cause is rarely mysterious.
Plugged ducts reduce volume immediately and usually point to insufficient transport velocity or buildup from moisture or sticky dusts. Fan issues often trace back to belt slippage, rotor wear, or material buildup inside the fan housing. Leaks in ductwork from loose doors, broken joints, or corrosion silently steal airflow and increase operating cost.
System changes matter. Adding exhaust points or adjusting blast gates without rebalancing almost always degrades performance elsewhere. Rising pressure drop across the collector usually signals cleaning system issues, blinded filters, or incorrect cleaning settings.
Evaluating Dust Control
Airflow alone does not tell you whether dust exposure is actually reduced. That requires sampling. Two types of samples are typically used. Process or source samples measure dust concentrations directly at or near the emission source or the worker most affected. Ambient or background samples measure dust levels away from the source but within the same environment, helping separate source emissions from overall plant dust.
Sampling Tools and What They Are Good For
Instantaneous dust monitors provide real-time feedback. They are excellent for identifying major dust sources and evaluating control effectiveness during operation changes.
Gravimetric samplers provide time-weighted average concentrations and material analysis. They are essential for exposure evaluation, but poor at identifying when and where dust spikes occur. The best evaluations use both.
Practical Sampling Approaches
Short-term system-on versus system-off testing shows immediate control effectiveness. Before-and-after testing demonstrates the impact of new controls. A-B-A testing compares two control methods under identical conditions, then returns to the original system to confirm changes were not process-related. This approach is especially useful when deciding between competing control strategies.
Turning Data Into Answers
Dust control effectiveness can be evaluated graphically to visualize differences, or mathematically to quantify efficiency.
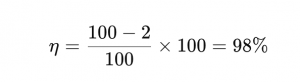
Efficiency is calculated as:
η = (Coff − Con) / Coff × 100%
What each term means
➡️ η (eta) – Collection efficiency, expressed as a percentage
➡️ Coff – Dust concentration before the collector (inlet concentration)
➡️ Con – Dust concentration after the collector (outlet concentration)
Concentrations are usually measured in units like mg/m³, grains/ft³, or similar.
Simple example
If:
✔️ Coff = 100 mg/m³
✔️ Con = 2 mg/m³
Then:
That means the dust collector is removing 98% of the particulate entering the system.
One important caveat
High efficiency doesn’t automatically mean safe recirculation or regulatory compliance. Even a 99.9% efficient system can still exceed OSHA limits if the inlet concentration is high or the dust is hazardous (silica, metals, combustible dust).
Repeated measurements at the same location should be treated statistically to account for variability. Recording operating conditions alongside measurements often explains results that would otherwise look inconsistent.
Baghouse Inspections: Catching Problems Before They Escalate
🔎 Daily Walk-Through and Maintenance
✔️ Take pressure drop readings
✔️ Check cleaning system performance (including compressors, dryer, filter)
✔️ Check valve and damper operation
✔️ Check dust removal system operation
✔️ Check emission levels
🔎 Weekly Check-In and Maintenance
✔️ Check diaphragm and solenoid operation
✔️ Take differential pressure and Magnehelic line readings
✔️ Check moving parts for wear/malfunction
✔️ Take differential pressure (delta P) readings after a cleaning cycle (if increasing over time, indicates bags becoming blinded)
✔️ Check compartment interiors visually for leaks
🔎 Quarterly Inspection and Maintenance
✔️ Remove sample bags for permeability flow testing
✔️ Check fan operation
✔️ Replace any failed bags
✔️ Lubricate high wear parts
✔️ Clean tubesheets
🔎 Annual Inspection and Maintenance
✔️ Perform dye testing of each compartment to check for leaks
The point of testing is to understand how the system behaves today compared to how it was designed to behave. When testing and inspections are done together, operators gain control instead of reacting to failures. Energy use drops, emissions stabilize, bag life improves, and production interruptions become far less common.
A dust collection system that is measured, understood, and maintained will always outperform one that is simply left running and hoped for the best.
Dust Collection Expert, Technical Writer & Editor at Baghouse.com
Andy Biancotti believes that knowledge is one of the best investments any company can make. As Editor and Marketing Manager at Baghouse.com, he enjoys interviewing engineers, technicians, and customers to capture the real-world lessons behind successful dust collection projects and turn them into practical resources that others can learn from. With more than two decades of experience in industrial maintenance, operations, and technical communication, his goal is simple: help people better understand their systems so they can work safer, smarter, and more efficiently.

 System-wide testing is how you catch those problems early. Done correctly, testing tells you whether your dust control system is still doing the job it was designed to do, and whether it can safely handle today’s production demands.
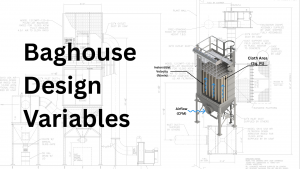

 Airflow inside a duct is never uniform. Measuring velocity at a single point gives you misleading data. Proper airflow measurement requires traversing the duct cross-section. Divide the duct into equal areas and measure velocity pressure at the center of each area. The smaller the areas, the more accurate the result.